Studio → Cases → To Discover Marrakech
To Discover Marrakech was seen 490 times in 61 days and 3,497 times in the next 61, and went from no comments at all to 28
32 posts built from 24 tours already listed and priced, on a 595 follower account that had gone 61 days without a single public reply. All 28 comments landed on posts we published.
What does a Marrakech host post, when the city is the draw?
To Discover Marrakech sells the medina, the High Atlas and the Agafay desert, 24 tours behind it and 22 of them bookable, on an account nobody was answering.
To Discover Marrakech sells the three things people come for: the medina under the Koutoubia minaret, the High Atlas, and the rolling stone hills of the Agafay desert, with a cooking class in between. 24 tours, 22 of them bookable, already photographed and priced on the operator's booking platform.
The account was not new. It carried 87 pieces of media and 595 followers. What it did not have was a week that looked like anything: across the 61 days before this started Instagram recorded 490 views, 155 people reached, 14 interactions and not one comment.
Advertising on this account comes to one person's worth of reach in each window. Instagram reports 1 paid reach and 1 paid view before, and 1 of each after, against account totals of 156 and 371 on reach and 491 and 3,498 on views. None of it is counted on this page. The spend did not move in either direction and it changes no figure here.
What did Leanboat Studio do?
Leanboat Studio built 32 Instagram posts from To Discover Marrakech’s own tours and photographs and published them on To Discover Marrakech’s own account, across 61 days.
- Read the catalogue. 24 tours from the operator's booking platform, 22 bookable, photographs included. We asked the host for nothing new.
- Composed one post per tour. 22 single images, 6 carousels and 4 stories. No video, no reels.
- Sent every post for approval. Approval was the operator's only job, and nothing went out without it.
- Published on the operator's own account, each post carrying one keyword.
- Answered the keyword by direct message. A follower who comments the keyword gets the booking link back, so a comment on this account is a request for the link rather than applause.

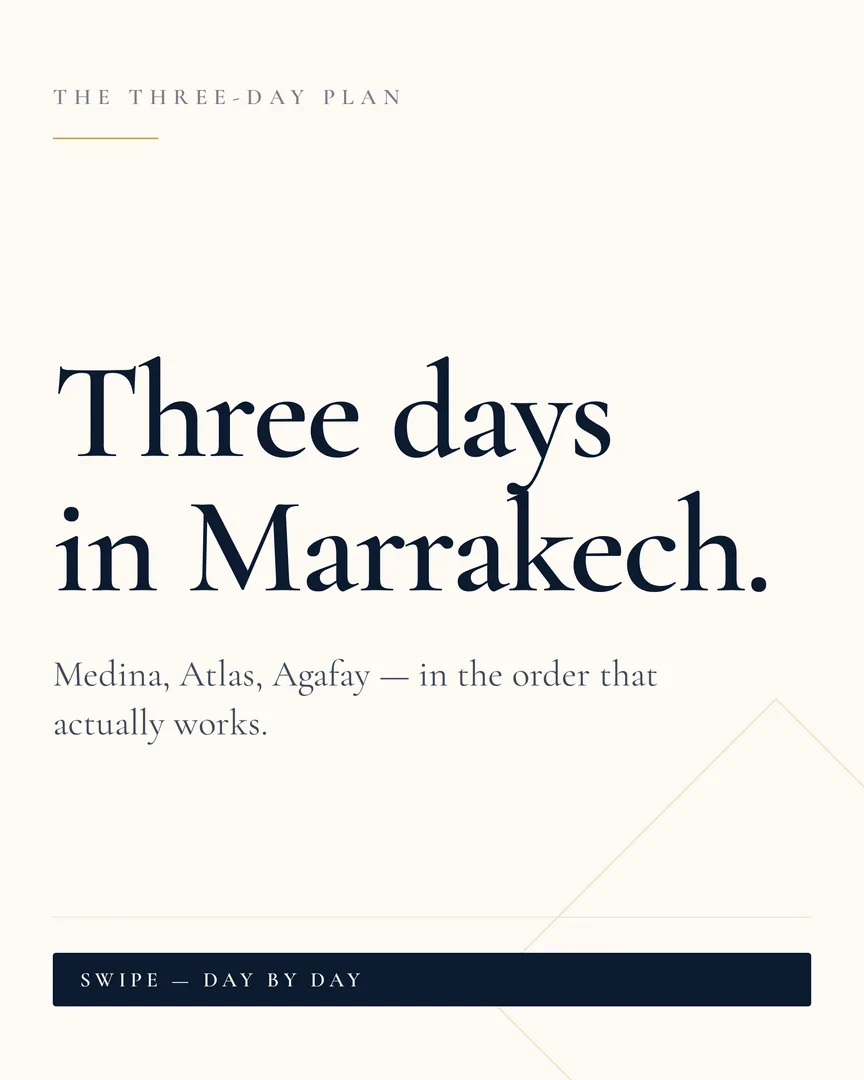


Four of the 32 posts, the most recent the operator published. Nobody picked these four as favourites.
How was this measured?
Leanboat Studio compares two equal windows, the days before an operator's first post and the same number after it, and for this operator it uses only the part of each figure that Instagram attributes to organic content rather than to ads.
61 days rather than 90, because that is the whole time this operator has been live. Stretching the before window without stretching the after would flatter the result. Both move together.
The ad side of this account is one person's worth of reach in each window, and it is left out anyway. What is printed here is the organic column Instagram publishes underneath the account totals.
What were the results?
On this account, views went from 490 to 3,497, and comments went from none at all to 28.
Views. Bars share one scale.
| What we measured | Before | After | Change |
|---|---|---|---|
| Views | 490 | 3,497 | +3,007 |
| Comments | 0 | 28 | +28 |
| Interactions | 14 | 179 | +165 |
| Interactions on posts alone | 7 | 141 | +134 |
| Likes | 10 | 127 | +117 |
| People reached | 155 | 370 | +215 |
Every figure above comes from Instagram account insights for the two windows named. Post counts and formats come from Leanboat Studio’s publishing record.
What changed on the account
595 followers, 87 posts, and 61 days without a single reply
Before we started, Instagram recorded 490 views, 155 people reached, 14 interactions and no comments at all across 61 days. The account existed, and the week did not look like anything.
32 posts went out on a fixed weekly rhythm, built from tours already listed and priced. Views went 490 to 3,497, interactions 14 to 179, and 0 comments became 28, all 28 of them on posts we published. An account seen 490 times in two months was seen 3,497 times in the next two.
What this does not show
- Advertising is present in both windows and comes to almost nothing: 1 person's worth of ad reach in the 61 days before and 1 in the 61 after. None of it is counted here, it changes no figure on this page, and it means this case says nothing either way about what happens when money goes behind an account.
- Every absolute number here is small: 595 followers, 370 people reached, 179 interactions, 28 comments, 25 accounts engaged. Read them against the size of this account rather than against a larger one.
- The before window is too low to carry a percentage. The claim is the move itself: 490 to 3,497 on views, 14 to 179 on interactions, 0 to 28 on comments.
- Reach is the one metric here that does not split cleanly. The surfaces count the same person more than once and do not sum to the account figure; the metric that does split exactly puts 141 of the 179 interactions on feed posts.
- Leanboat Studio publishes no reels, so the 82 reach on that surface is the operator's own, up from 6 in the window before, and so is the 1 on IGTV.
- 4 of the 32 posts return no per-post figures. The 28 that do summed 1,011 reach against the account's 370, so that sum is a floor and a check rather than a reach figure of its own.
- Nobody asked for the booking link. 34 keyword automations were armed across the posts and none fired, so there is no demand reading here.
- Saves read -1 before and 1 after. Instagram nets saves against unsaves and returns the difference, which is how a count lands below zero, and nothing on this page is built on it.
- 61 days of posting alongside everything else the operator did. A before-and-after around a start date on one account is a correlation rather than a controlled trial.
- Nothing here is a booking. Instagram does not report what happens after a link.
Is this typical, or is it the best case?
Leanboat Studio does not publish a cohort comparison yet, so this page cannot tell you where To Discover Marrakech sits against every other operator.
There was one here, and it came down. It was assembled from a sweep across every partner at once, and a sweep is exactly the thing that hides a bad figure inside an average. Every partner is now being read end to end on its own page, and a median goes back up only once that is true of all of them.
Until then, read this as one operator’s result. It is not an average and it is not a promise about your account.
Your tours are already photographed.
The posts are the missing hour. Connect one account and approve what goes out.