Studio → Cases → North Adventures
In Québec, North Adventures went from no comments at all to 22, and from 11 interactions to 53
24 posts built from 16 tours already listed and priced, on an account of 1,000 followers carrying 373 posts of its own. Every comment in the after window landed on a feed post we published, and no advertising ran on either side of the comparison.
How does a day-trip operator keep a feed going through the season?
North Adventures had 16 tours already listed and priced across Ottawa, Montréal and Mont-Tremblant, and an account that posted for years without ever being replied to.
North Adventures runs day trips out of Québec: Canada's capital in one day, the gondola station at Mont-Tremblant, Montreal with no group and no fixed route. 16 tours, all 16 bookable, already photographed and priced on the operator's booking platform.
The account had 373 posts and 1,000 followers behind it, and in Instagram's own breakdown of the before window the feed surface does not appear at all. Everything the account did came from stories and from the operator's own reels.
No advertising ran in either window, so nothing here was bought and nothing needed separating out. More than half of what the account reached in the after window still came from the operator's reels, which are the operator's own work and which this page claims none of. What the breakdown does show is where the new movement sits: 32 of the 53 interactions and all 22 comments on the feed posts, carousel reach from 9 to 92, story reach from 209 to 290.
The two windows are equal by construction, 68 days each. 68 rather than 90 because that is the whole time this operator has been live, and both windows move together.
What did Leanboat Studio do?
Leanboat Studio built 24 Instagram posts from North Adventures’s own tours and photographs and published them on North Adventures’s own account, across 68 days.
- Read the catalogue. 16 tours from the operator's booking platform, all 16 bookable, photographs included. We asked the operator for nothing new.
- Composed one post per tour. 18 single images, 4 carousels and 2 stories. No video, no reels.
- Sent every post for approval. Approval was the operator's only job, and nothing went out without it.
- Published on the operator's own account, each post carrying one keyword.
- Answered the keyword by direct message. A follower who comments the keyword gets the booking link back, so a comment on this account is a request for the link rather than applause.
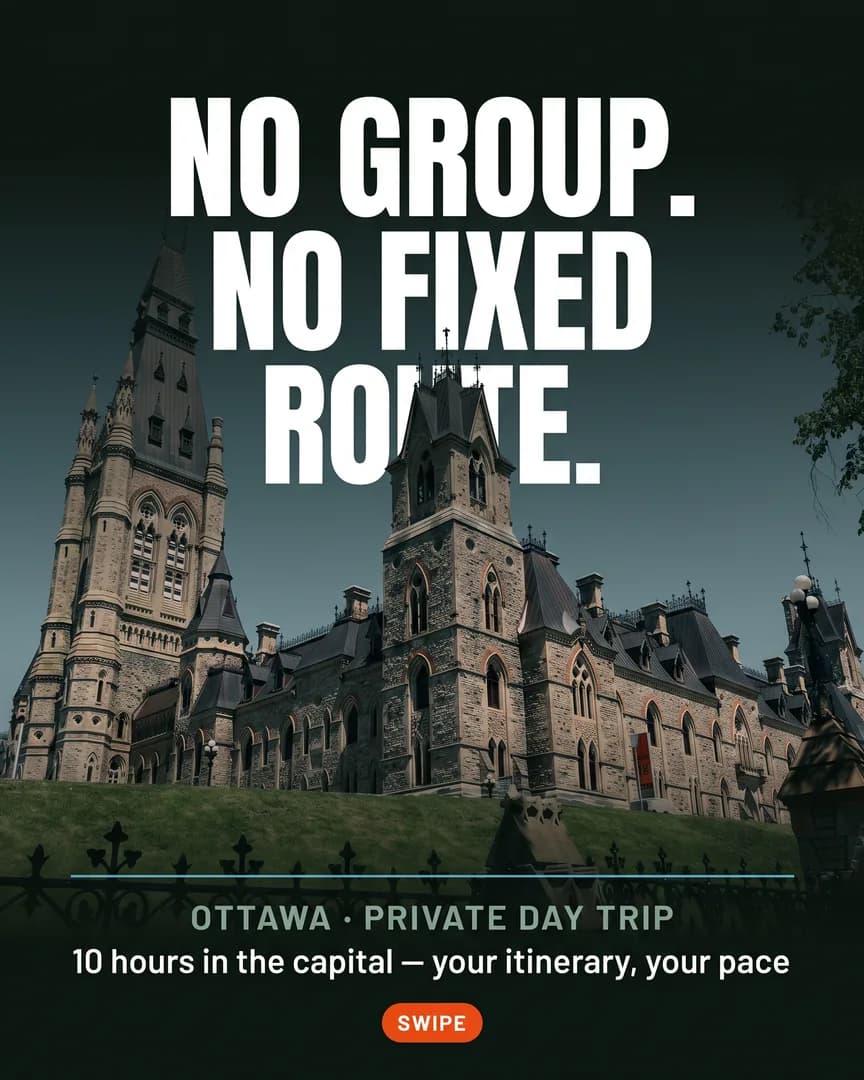
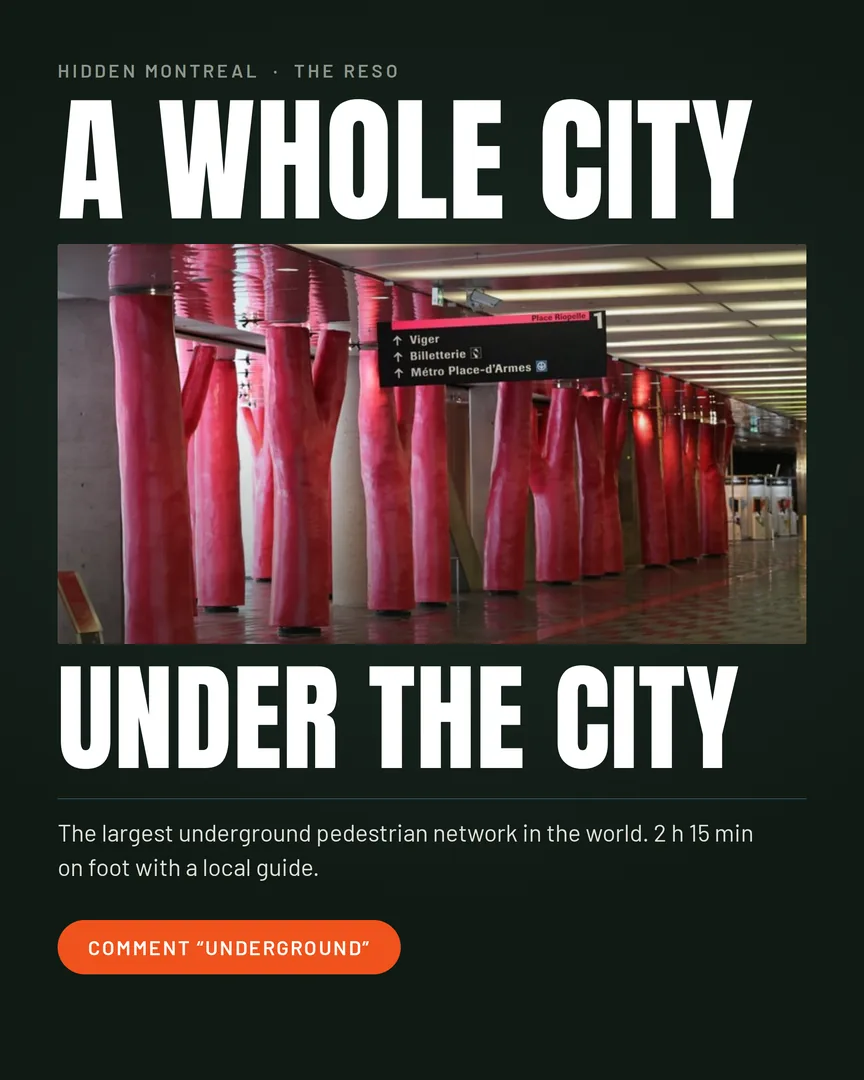

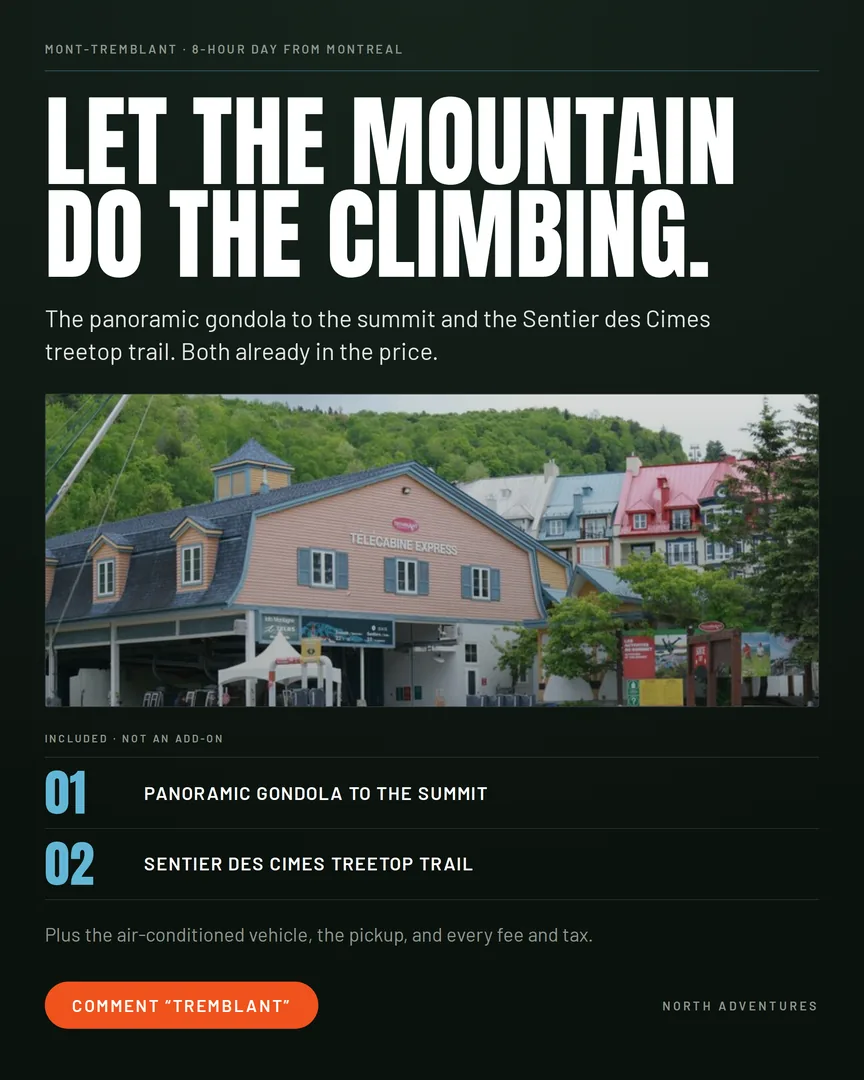
Four of the 24 posts, the most recent the operator published. Nobody picked these four as favourites.
How was this measured?
Leanboat Studio measures account-level reach across two equal windows, the days before an operator's first post and the same number of days after it, using Instagram's own account insights.
68 days rather than 90, because that is the whole time this operator has been live. Stretching the before window without stretching the after would flatter the result. Both move together.
Account-levelcovers the operator’s entire Instagram account, not only the posts we built. That is the harder number to move and the honest one to report, because the question you would ask is what happened to your account, not how somebody’s posts performed.
It also means other things the operator does land in the same figures: their own reels, a promotion, a busy season, money they choose to put behind the account. We do not strip those out, because an account is a mix and the mix is the point. A daily rhythm underneath it is what makes the rest worth doing, and the question each page answers is whether the account as a whole got better.
What were the results?
On this account, comments went from none at all to 22, and interactions went from 11 to 53.
Comments. Bars share one scale.
| What we measured | Before | After | Change |
|---|---|---|---|
| Comments | 0 | 22 | +22 |
| Interactions | 11 | 53 | +42 |
| Interactions on posts alone | 0 | 32 | +32 |
| Likes | 12 | 23 | +11 |
| People reached | 743 | 1,033 | +290 |
| Views | 1,868 | 3,993 | +2,125 |
Every figure above comes from Instagram account insights for the two windows named. Post counts and formats come from Leanboat Studio’s publishing record.
What changed on the account
A feed that Instagram's breakdown could not even see
Before we started, this account had 373 posts of its own history and recorded no comments at all across 68 days. Its feed surface registered no interactions whatsoever: everything the account did came from stories and from the operator's own reels.
24 posts went out on a fixed weekly rhythm, built from 16 tours already listed and priced. 0 comments became 22, every one of them on a feed post we published, and interactions went from 11 to 53 with 32 of those on the feed. A surface that did not register before now carries the conversation on this account.
What this does not show
- No advertising ran in either window. Instagram reports 0 ad reach before and 0 after, so nothing here was bought and nothing needed separating out.
- The whole result rests on 23 accounts engaged. 1,000 followers and 373 posts of history sit behind that number, and 23 is how many accounts Instagram recorded responding in the after window. Read the page at that size.
- 563 of the 1,033 people reached came from reels, which we do not publish. More than half the account's reach is the operator's own video and this page claims none of it.
- The attribution check reads 0.9x: 22 posts summed 1,089 reach against 1,033 on the account. Summed per-post reach counts the same person once per post, so it is a check that nothing outside our posts carried the window rather than a reach figure of its own.
- Saves read -9 before and -11 after. Instagram nets saved content against unsaved and returns the difference, the whole of both figures sits on reels, and nothing on this page is built on it.
- The before window is low rather than empty: 743 people reached and 11 interactions across 68 days. Small absolute numbers move easily, which is why every figure here is a count and no rate is quoted.
- The conversion path never ran. 39 keyword automations were armed across the window and none fired, so there is no demand reading here and no booking claim of any kind.
- 68 days is a short read, and the 24 posts ran alongside everything else the operator did. The posts and the rise happen together, which is correlation and not proof that one caused the other.
- Nothing here is a booking. Instagram does not report what happens after a link.
Is this typical, or is it the best case?
Leanboat Studio does not publish a cohort comparison yet, so this page cannot tell you where North Adventures sits against every other operator.
There was one here, and it came down. It was assembled from a sweep across every partner at once, and a sweep is exactly the thing that hides a bad figure inside an average. Every partner is now being read end to end on its own page, and a median goes back up only once that is true of all of them.
Until then, read this as one operator’s result. It is not an average and it is not a promise about your account.
Your tours are already photographed.
The posts are the missing hour. Connect one account and approve what goes out.