Studio → Cases → Innovation Tours
In Egypt, Innovation Tours went from 336 people reached to 424 and from 24 interactions to 100 in 67 days, and it did that on its own reach while the advertising wound down
This account's own reach went 336 to 424 and its interactions went 24 to 100, and the interesting part is what it was doing at the same time: it grew the reach it earns while the reach it buys came down to almost nothing. 25 posts went out, built from 12 tours that were already listed and priced, and the response landed on the surfaces Leanboat Studio publishes on: reach on single posts went 157 to 301, interactions on single posts went 22 to 97, and comments went 3 to 25. This is a 4,080 follower account and 13 accounts engaged with it in the after window, so every figure here is small in absolute terms.
What is an account worth once it stops buying its audience?
Innovation Tours had 12 tours listed and priced, and across 67 days the reach it earned grew while the reach it bought came down to almost nothing.
The operator sells Egypt: the stone pylons of Philae at Aswan, the chalk formations of the White Desert, a felucca on the Nile at sunset. All 12 tours were already listed, priced and photographed on the operator's booking platform.
This account advertised heavily before we started and barely at all afterwards. Instagram's own account insights record 2,552 people's worth of advertising reach in the 67 days before production began and 1 in the 67 days after, and the account's total reach came down from 2,888 to 425 with total views from 3,609 to 1,665 as that spend came off. Comparing those totals would read as collapse; comparing 336 against 424 is the only honest version, and both are set out here.
We were asked to keep the account posting without asking the operator for anything new. No shoot, no brief, no extra hour in a week that did not have one. The challenge was to turn a catalogue that already existed into weekly presence, and to leave the operator with a single decision: approve, or do not.
What did Leanboat Studio do?
Leanboat Studio built 25 Instagram posts from Innovation Tours’s own tours and photographs and published them on Innovation Tours’s own account, across 67 days.
- Read the catalogue. 12 tours from the operator's booking platform, 12 bookable, photographs included. We asked the operator for nothing new.
- Composed one post per tour. 21 single images, 2 carousels and 2 stories. No video, no reels.
- Sent every post for approval. Approval was the operator's only job, and nothing went out without it.
- Published on the operator's own account, each post carrying one keyword.
- Answered the keyword by direct message. A follower who comments the keyword is asking for the booking link, so a comment on this account is a request rather than applause.
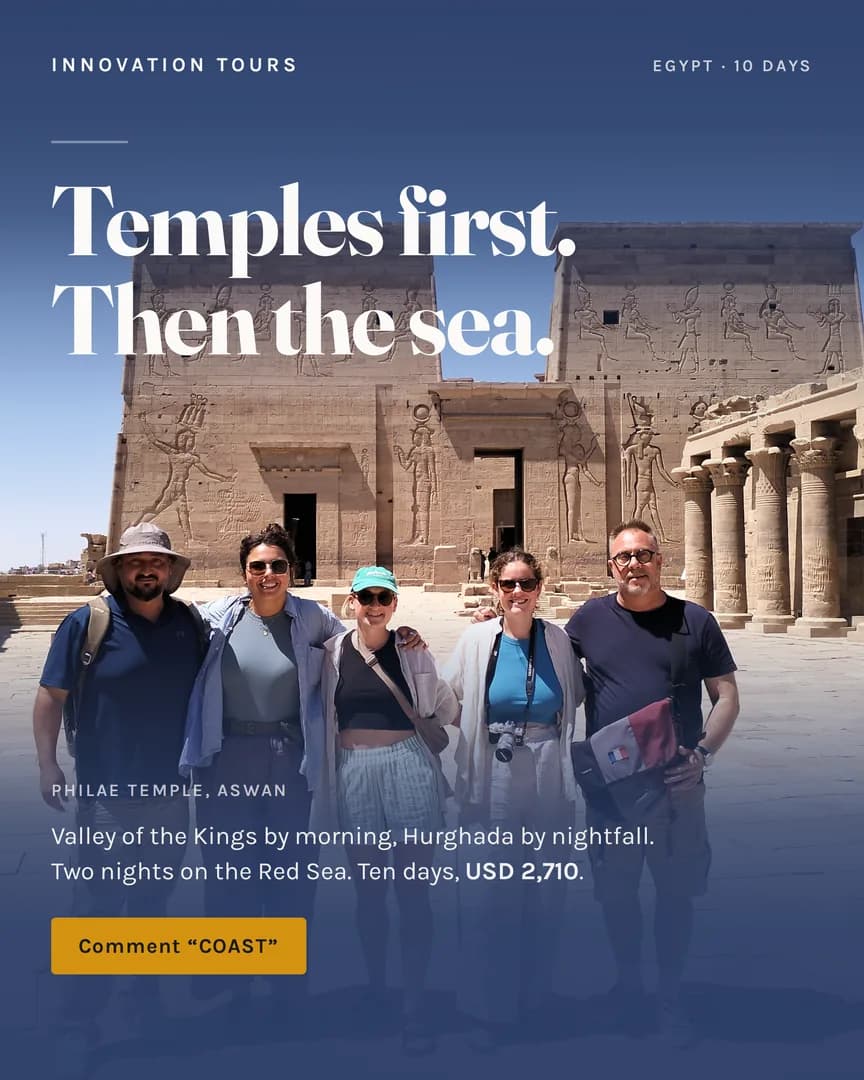



Four of the 25 posts, the most recent the account published.
How was this measured?
Leanboat Studio compares two equal windows, the days before an operator's first post and the same number after it, and for this operator it uses only the part of each figure that Instagram attributes to organic content rather than to ads.
67 days rather than 90, because that is the whole time this operator has been live. Stretching the before window without stretching the after would flatter the result. Both move together.
This account advertised heavily before we started and barely at all afterwards, so every figure here is the organic side of Instagram's own breakdown on both sides. That is the like-for-like read, and the totals are printed in the prose so nobody has to take it on trust.
What were the results?
On this account, people reached went from 336 to 424, and interactions went from 24 to 100.
People reached. Bars share one scale.
| What we measured | Before | After | Change |
|---|---|---|---|
| People reached | 336 | 424 | +88 |
| Interactions | 24 | 100 | +76 |
| Comments | 3 | 25 | +22 |
| Likes | 12 | 59 | +47 |
| Views | 547 | 1,663 | +1,116 |
| Interactions from posts alone | 22 | 97 | +75 |
Every figure above comes from Instagram account insights for the two windows named. Post counts and formats come from Leanboat Studio’s publishing record.
What changed on the account
An account that was renting its audience, now earning a bigger one
Before we started, most of the people this account reached had been paid for, and 336 is what it reached on its own underneath that spend.
25 posts went out on a fixed weekly rhythm and the earned side grew: 424 people reached, 100 interactions, and 25 comments against 3 in the window before. 24 of those 25 comments landed on posts we published, and reach on feed posts went 157 to 301. The account now reaches more people on its own than it did while it was buying, and it keeps doing that on the weeks nobody spends anything.
What this does not show
- The operator advertised heavily before production and stopped: 2,552 of the people reached in the before window were bought, against 1 after, and none of that reach is counted anywhere above.
- The before window is the advertised one, so the total columns are not comparable. 336 against 424 is the honest comparison, and both sets of figures are printed in the prose.
- Every absolute here is small: 424 people reached, 100 interactions and 25 comments on an account of 4,080 followers, with 13 engaged accounts carrying the whole result.
- Our 24 measured posts summed 692 reach between them against 424 unique on the account. Summed per-post reach counts the same person once per post, so it is not a count of people.
- 241 of the 547 organic views in the before window came back in a dimension Instagram does not name, so the view comparison is weaker than the interaction comparison, which splits exactly.
- Shares went 4 to 0, saves were 0 on the organic side in both windows, and taps on the profile link were 0 in both. None of the 34 keyword automations fired, so the booking-link path never ran and nobody was offered a link and turned it down.
- This is a before-and-after on one account across 67 days, not a controlled test. Nothing here is a booking; Instagram does not report what happens after a link.
Is this typical, or is it the best case?
Leanboat Studio does not publish a cohort comparison yet, so this page cannot tell you where Innovation Tours sits against every other operator.
There was one here, and it came down. It was assembled from a sweep across every partner at once, and a sweep is exactly the thing that hides a bad figure inside an average. Every partner is now being read end to end on its own page, and a median goes back up only once that is true of all of them.
Until then, read this as one operator’s result. It is not an average and it is not a promise about your account.
Your tours are already photographed.
The posts are the missing hour. Connect one account and approve what goes out.